East Phillips at a glance:
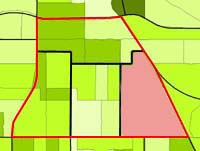
 

East Phillips


Get census statistics for each of the Phillips regions. Choose from the list below:


Return to PNN Census 2000 home


Visit the East Phillips website

Comparison statistics for the City of Minneapolis are shown in [brackets].


SIZE 0.4 square miles [54.9]


POPULATION

  • Individuals: 4,147 [382,618]
  • Households: 1,090 [162,352]
  • Families: 751 [73,939]
  • Children under 18: 1,697 - 40.9% of population [84,169 - 22.0%]


DIVERSITY

  • Native American: 943 - 22.7% of population [8,378 - 2.2% of City]
  • Black: 967 - 23.3% [68,818 - 18.0%]
  • Latino: 1,121 - 27.0% [29,175 - 7.6%]
  • Asian: 309 - 7.5% [23,744 - 6.2%]
  • White: 975 - 23.5% [249,186 - 65.1%]
  • Total non-white: 3,172 - 76.5% [133,432 - 34.9%]


MEDIAN FAMILY INCOME

$24,049 [$48,602]


MEDIAN HOUSEHOLD INCOME

$23,346 [$37,974]


FAMILIES BELOW POVERTY

260 - 34.6% of neighborhood families [8,868 - 11.9%]


CHILDREN LIVING IN POVERTY

665 - 40.8% of all neighborhood children [20,477 - 25.1%]


UNEMPLOYMENT

187 - 11.5% of workers [12,778 - 5.8%]


HOUSING

  • Total number of housing units: 1,162 [168,606]
  • Vacant units: 72 - 6.2% of neighborhood units [6,254 - 3.7%]
  • Owner occupied units: 342 - 29.4% [83,408 - 51.4%]
  • Renter-occupied units: 748 - 64.4% [78,944 - 48.6%]


Data source: U.S. Census Bureau, Census 2000


prepared by community design group // www.c-d-g.org