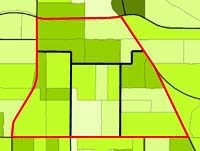
Phillips at a glance:


Neighborhood Profiles


Get census statistics for each of the Phillips regions. Choose from the list below:


You can also choose from the following options (showing overall figures for Phillips):


View a chart:


Compare figures:


Return to the PNN mainpage

Comparison statistics for the City of Minneapolis are shown in [brackets].


SIZE 1.6 square miles [54.9]


POPULATION

  • Individuals: 19,805 [382,618]
  • Households: 6,333 [162,352]
  • Families: 3,155 [73,939]
  • Children under 18: 6,336 - 32.0% of Phillips population [84,169 - 22.0%]


DIVERSITY

  • Native American: 2,352 - 11.9% of Phillips [8,378 - 2.2% of City]
  • Black: 5,825 - 29.4% [68,818 - 18.0%]
  • Latino: 4,385 - 22.1% [29,175 - 7.6%]
  • Asian: 1,216 - 6.1% [23,744 - 6.2%]
  • White: 6,258 - 31.6% [249,186 - 65.1%]
  • Total non-white: 13,547 - 68.4% [133,432 - 34.9%]


MEDIAN FAMILY INCOME

$26,405 [$48,602]


MEDIAN HOUSEHOLD INCOME

$21,353 [$37,974]


FAMILIES BELOW POVERTY

1,034 - 31.9% of Phillips families [8,868 - 11.9%]


CHILDREN LIVING IN POVERTY

2,538 - 40.6% of all children in Phillips [20,477 - 25.1%]


UNEMPLOYMENT

956 - 12.4% of workers [12,778 - 5.8%]


HOUSING

  • Total number of housing units: 6,734 [168,606]
  • Vacant units: 401 - 6.0% of Phillips units [6,254 - 3.7%]
  • Owner occupied units: 1,366 - 20.3% [83,408 - 51.4%]
  • Renter-occupied units: 4,967 - 73.8% [78,944 - 48.6%]


Data source: U.S. Census Bureau, Census 2000


prepared by community design group // www.c-d-g.org